Measurement and DAGs
Content for Thursday, February 1, 2024
Readings
Measurement
- The witch trial scene from Monty Python and the Holy Grail
- Chapter 5 in Evaluation: A Systematic Approach (Rossi, Lipsey, and Henry 2019). This is available on iCollege.
- Chapter 5 in The Effect (Huntington-Klein 2021)
DAGs
- Julia M. Rohrer, “Thinking Clearly About Correlations and Causation: Graphical Causal Models for Observational Data” (Rohrer 2018) This will be posted on iCollege.
- Section 2 only (pp. 4–11) from Julian Schuessler and Peter Selb, “Graphical Causal Models for Survey Inference.” (Schuessler and Selb 2019) The PDF is available at SocArXiv.
- Chapters 6 and 7 in The Effect (Huntington-Klein 2021)
DAG example page
- The example page on DAGs shows how to draw and analyze DAGs with both dagitty.net and R + {ggdag}
Slides
The slides for today’s lesson are available online as an HTML file. Use the buttons below to open the slides either as an interactive website or as a static PDF (for printing or storing for later). You can also click in the slides below and navigate through them with your left and right arrow keys.
Tip
Fun fact: If you type ? (or shift + /) while going through the slides, you can see a list of special slide-specific commands.
Videos
Videos for each section of the lecture are available at this YouTube playlist.
You can also watch the playlist (and skip around to different sections) here:
In-class stuff
Here are all the materials we’ll use in class:
- Session 4 FAQ slides (PDF)
- Live code on Dropbox
- Regression playground Posit.cloud project
- Regression playground project
.zipfile
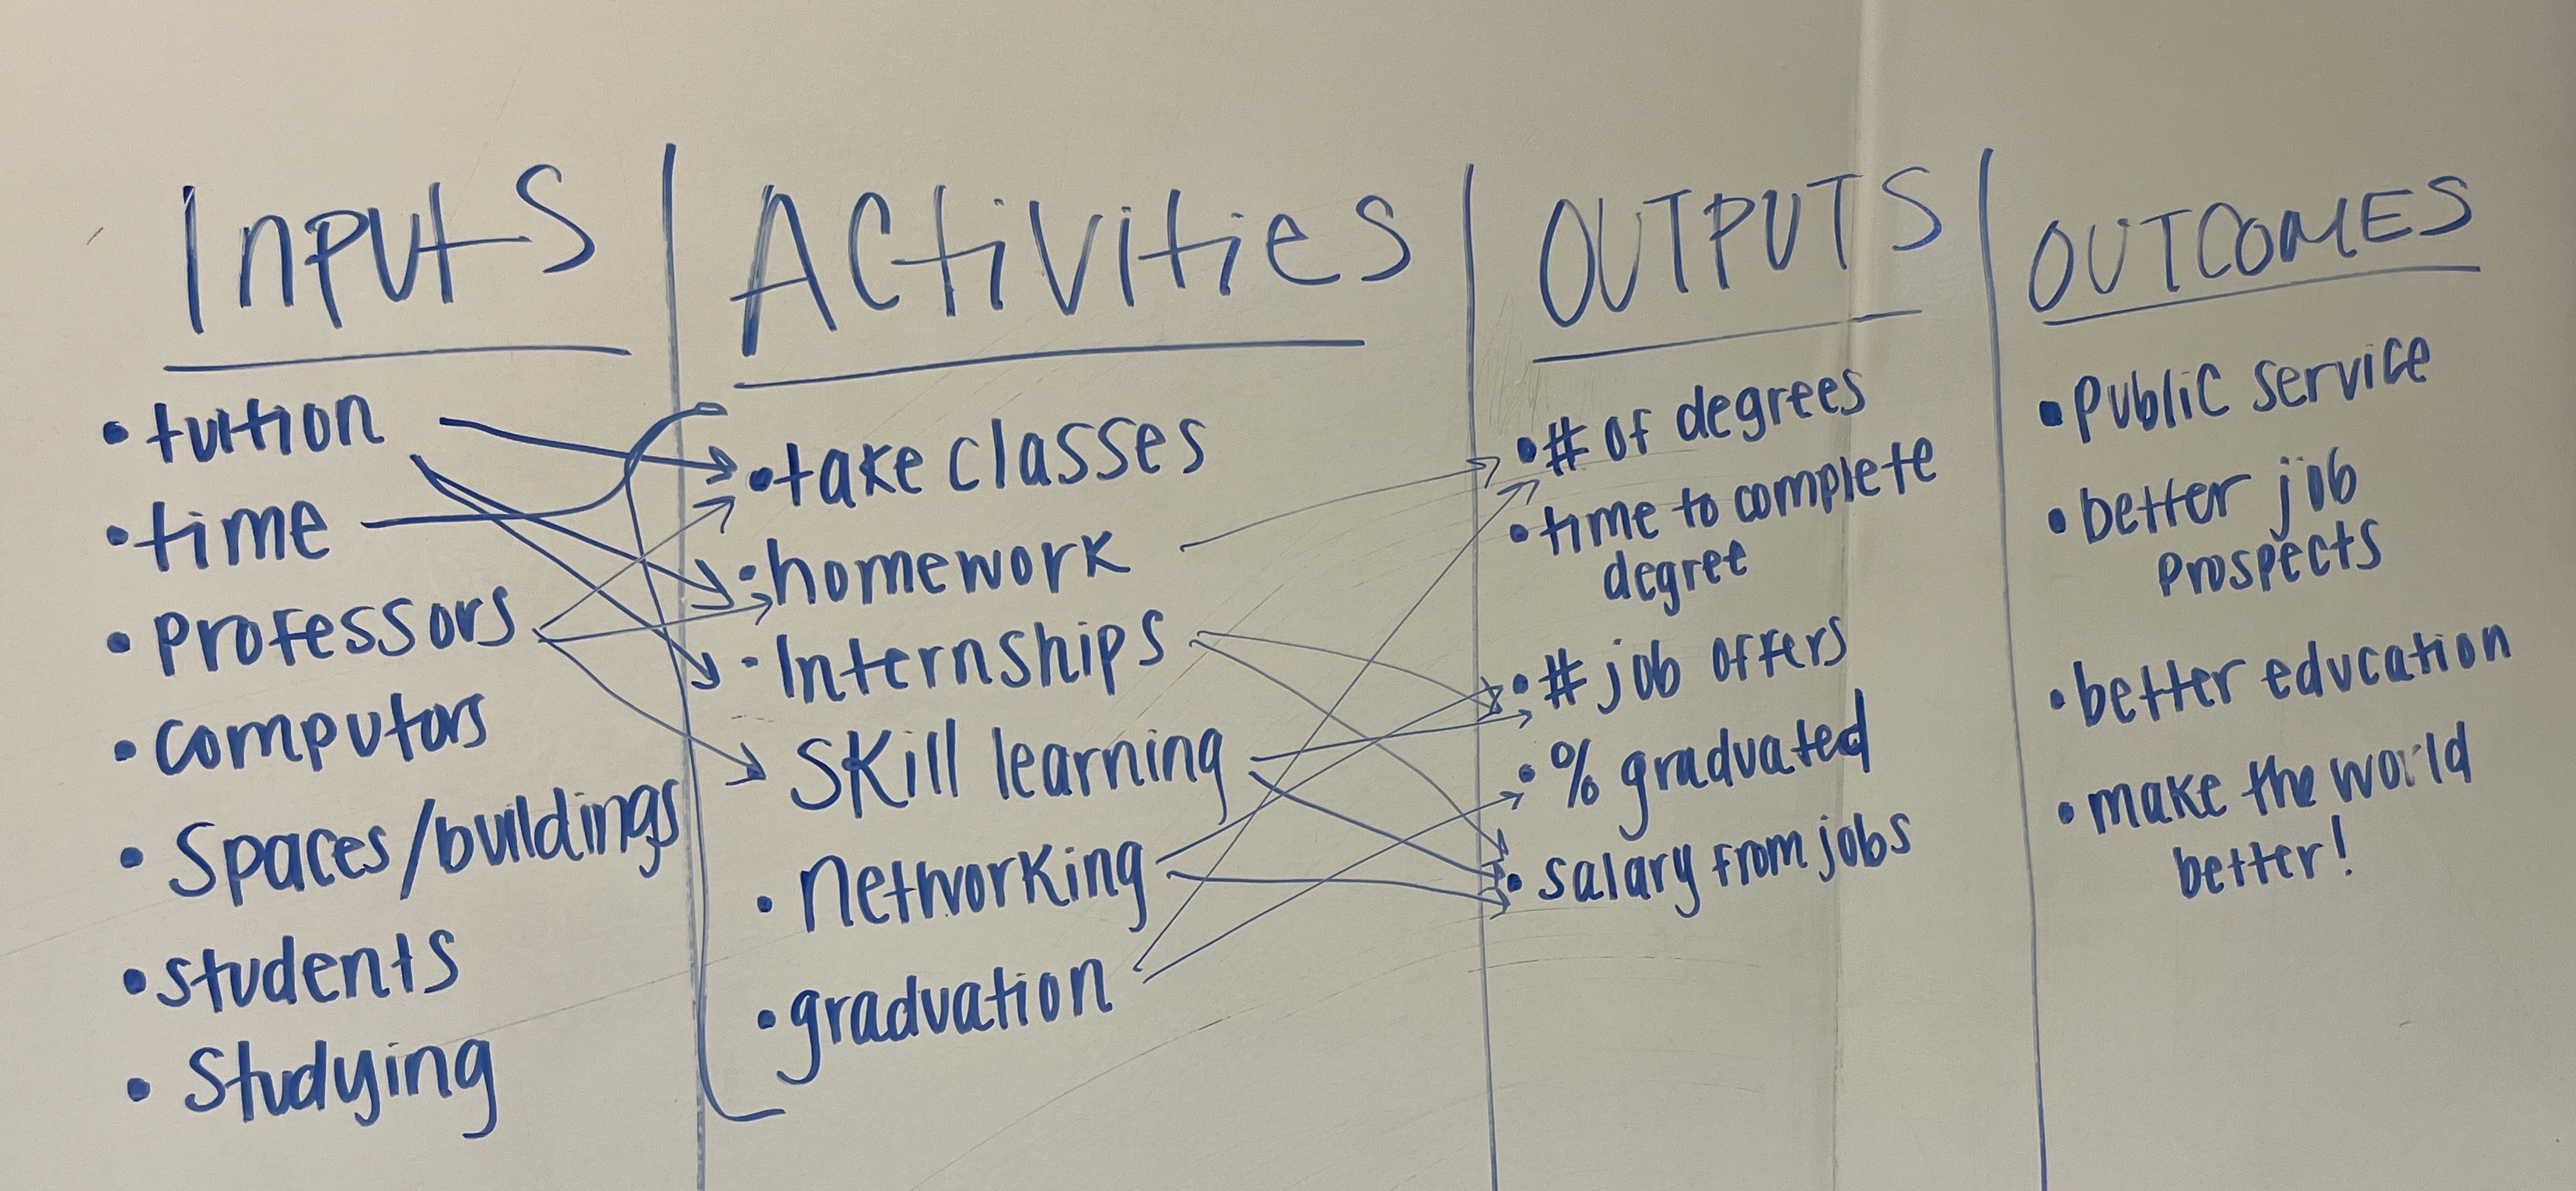
Logic model for MPA/MPP program
References
Huntington-Klein, Nick. 2021. The Effect: An Introduction to Research Design and Causality. Boca Raton, Florida: Chapman and Hall / CRC. https://theeffectbook.net/.
Rohrer, Julia M. 2018. “Thinking Clearly about Correlations and Causation: Graphical Causal Models for Observational Data.” Advances in Methods and Practices in Psychological Science 1 (1): 27–42. https://doi.org/10.1177/2515245917745629.
Rossi, Peter H., Mark W. Lipsey, and Gary T. Henry. 2019. Evaluation: A Systematic Approach. 8th ed. Los Angeles: SAGE.
Schuessler, Julian, and Peter Selb. 2019. “Graphical Causal Models for Survey Inference.” Working Paper; SocArXiv. https://doi.org/10.31235/osf.io/hbg3m.
